#performance #java #memory
In this series we will look at different ways to figure out and fix unnecessary memory consumption by JVM. This is useful for JVM applications that store huge amount of data in memory and can help avoid OutOfMemoryError if application data cannot be partitioned and scaled horizontally.
In part 1, let’s take a look on how to identify which objects are responsible for increased heap size. In part 2, I’ll list a few optimization techniques that should help reduce heap size.
We will not look at memory leak detection in this post, however most profiling methods in this article will be useful in finding those too. We will also not focus on garbage-free approach to Java code. Let me know if you’re interested in these topics as well.
Source code of examples can be found here.
Example application
This corresponds to example 1.
To emulate application with long-term memory store, we will launch separate JVM and we are going to feed it orders as such:
public final class Order {

    private final String id;
    private final String user;
    private final Integer articleNr;
    private final int count;
    private final int price;
    private final String address;

    // rest of class omitted for clarity
}
To compare runs of different implementations instances of Order are created deterministically by seeding Random with the same seed.
To represent real-life data scenario we will take Alaska, USA address dataset collected by OpenAddresses, courtesy of Municipality of Anchorage.
Orders are sent via stdin pipe, read by Scanner and stored in example application in 2 maps, keyed by id and user:
String received = scanner.nextLine();
Order order = mapper.readValue(received, Order.class);
ordersById.put(order.getId(), order);
ordersByUser
        .computeIfAbsent(order.getUser(), key -> new ArrayList<>())
        .add(order);
Running our memory hungry application in JVM with -Xmx64m` we get:
Total orders: 204785
Total users: 54643
Exception in thread "main" java.lang.OutOfMemoryError: Java heap space
	at java.base/java.io.Reader.read(Reader.java:188)
	at java.base/java.util.Scanner.readInput(Scanner.java:882)
	at java.base/java.util.Scanner.findWithinHorizon(Scanner.java:1796)
	at java.base/java.util.Scanner.hasNextLine(Scanner.java:1610)
	at com.romanmarkunas.blog.memory.example1.OrderStoreMain.main(OrderStoreMain.java:19)
Let’s pretend we don’t know what is the most memory hungry part of application and see how we can find out biggest memory consumers within JVM.
Profiling - memory release pattern
Much of the profiling we do in this section relies on production-like data for real system. This is why it is highly advised to have most of mentioned JVM options enabled proactively for production system to properly monitor memory consumption.
First we need to identify what is the source of OutOfMemoryError. Potentially we could have a current thread stack allocating and holding too many objects as part of it’s immediate operation (e.g. loading a huge file into memory in one go), so there might be problem with sizing JVM memory or algorithm. Alternatively, if we see a “sawtooth” pattern we could conclude that memory is being held long term. This corresponds to example 2.
Running with -Xlog:gc (or -verbose:gc prior to Java 9), would give us following (-XX:+PrintGCDetails omitted for clarity, run java -Xlog:help for more options on logging post Java 8):
[0.008s][info][gc] Using G1
[0.455s][info][gc] GC(0) Pause Young (Normal) (G1 Evacuation Pause) 24M->3M(64M) 5.136ms
[0.675s][info][gc] GC(1) Pause Young (Normal) (G1 Evacuation Pause) 38M->7M(64M) 18.182ms
...
[2.021s][info][gc] GC(77) To-space exhausted
[2.021s][info][gc] GC(77) Pause Young (Normal) (G1 Evacuation Pause) 62M->61M(64M) 2.543ms
[2.027s][info][gc] GC(78) To-space exhausted
[2.027s][info][gc] GC(78) Pause Young (Normal) (G1 Evacuation Pause) 63M->63M(64M) 3.311ms
[2.102s][info][gc] GC(79) Pause Full (G1 Evacuation Pause) 63M->54M(64M) 74.398ms
...
[7.532s][info][gc] GC(171) Pause Full (G1 Evacuation Pause) 63M->63M(64M) 119.835ms
[7.532s][info][gc] GC(172) Pause Young (Normal) (G1 Evacuation Pause) 63M->63M(64M) 0.231ms
[7.655s][info][gc] GC(173) Pause Full (G1 Evacuation Pause) 63M->62M(64M) 122.730ms
// OutOfMemoryError here
Just as interesting side note - OutOfMemoryError happens while heap has little space left. Even though G1 is a compacting collector, slight memory fragmentation occurs (For example, each object from reclaimed region is too big to fit in left free space of almost full regions. Another case would be when, any region is taken by humongous object - more reading here).
Observing used heap size after each collection (number just after ->), we can see that it is always growing, creating infamous saw-tooth pattern. We can also observe (with -Xlog:gc*) that G1 garbage collector shrunk young generation to single region (1024K) by the time of crash:
[4.714s][info][gc,heap,exit   ] Heap
[4.714s][info][gc,heap,exit   ]  garbage-first heap   total 65536K, used 64505K [0x00000000fc000000, 0x0000000100000000)
[4.714s][info][gc,heap,exit   ]   region size 1024K, 1 young (1024K), 0 survivors (0K)
This suggests we have either too much data or memory leak. Next, let’s find out what exactly fills the memory.
Profiling - heap dumps
Let’s start with easiest approach, which is option -XX:+HeapDumpOnOutOfMemoryError -XX:HeapDumpPath=dump.hprof. This will give use heap dump in binary format. Now to make sense of it, we need to open with any useful dump analysis tool. I do not recommend VisualVM, because it’s very bad in guessing object sizes, and for our particular example it would show retained sizes bigger than heap itself. It also does not include thread frames in dominator lists, which often is helpful. For this example I’ll use Eclipse MAT, which is a free, standalone, feature-full and precise memory analyser tool.
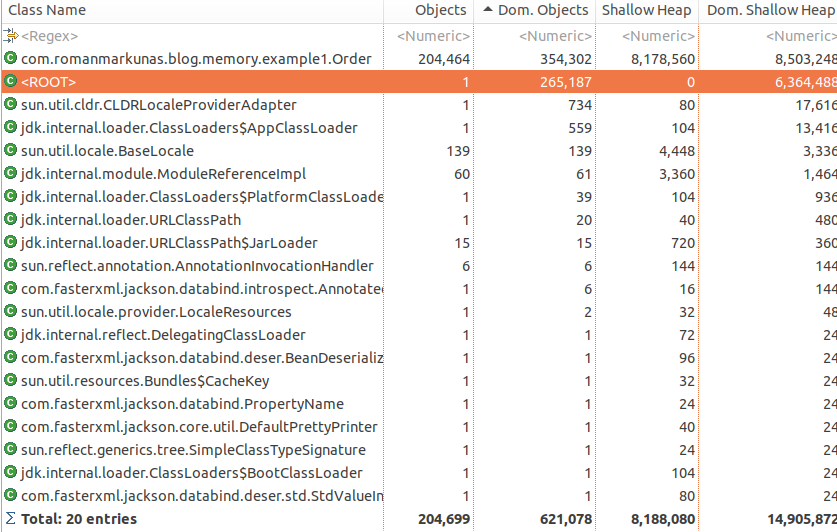
Once we open heap dump (example 3), it’s quite obvious to figure out where most JVM memory is consumed:
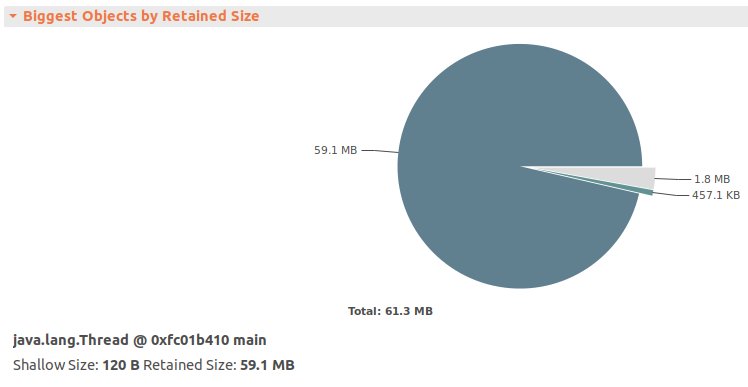
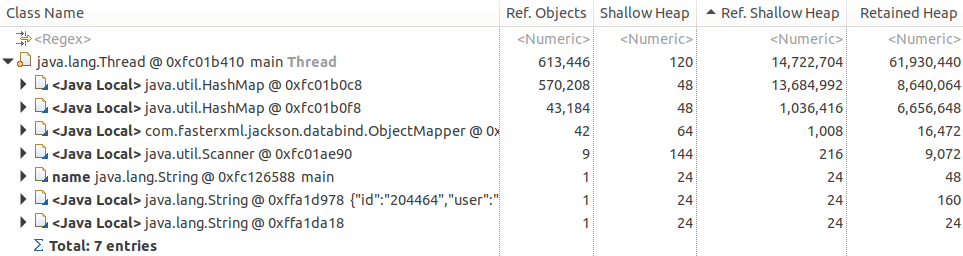
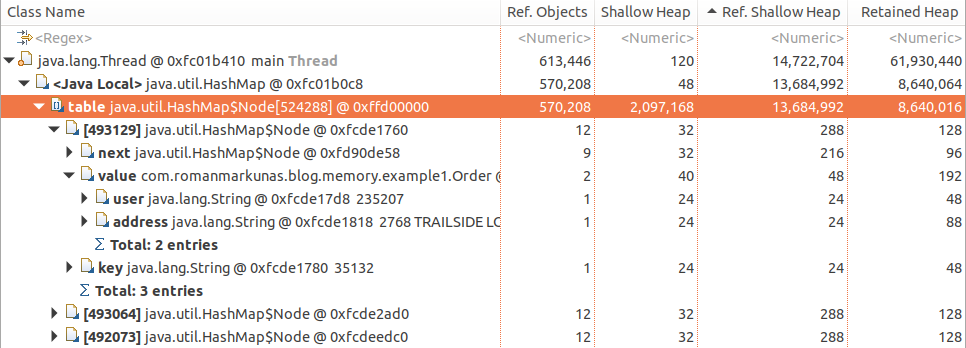
If we open dominator tree and sort by retained heap, we will see why it is the case:
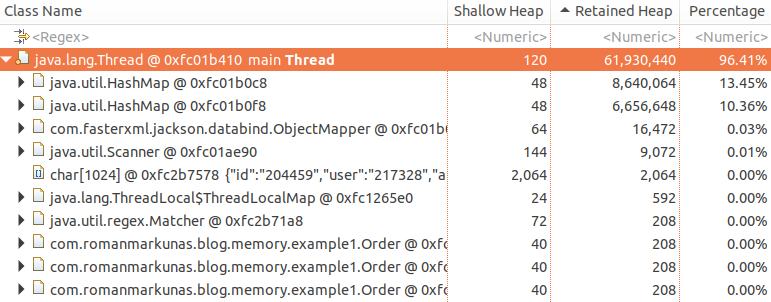
You may wonder why Order objects in dominator tree are children of Thread instead of HashMap and why retained heap of both HashMap’s is much smaller than total retained heap. The reason is that all Order objects are retained by both maps, so if any single map becomes unreachable, none of Order objects would be collected. However, if Thread becomes unreachable, both HashMap and in turn all Order will be eligible for garbage collection.
Retained heap of the object is total memory that would be reclaimed by GC if this object would become unreachable.
This is exactly reason why dominator trees are not useful to figure out memory consumption in real-life application. Big data structures like caches are often shared between components and referenced via multiple GC roots, therefore they do not appear in dominator trees. To demonstrate this we can put our order map as a static variable (example 4):
public class TwoGCRootsOrderStoreMain {

    private static Map<String, Order> ordersById = new HashMap<>();

    public static void main(String[] args) {
        Map<String, Order> ordersById = TwoGCRootsOrderStoreMain.ordersById;
        // rest of code omitted
    }
}
and the dominator tree of that would look like:
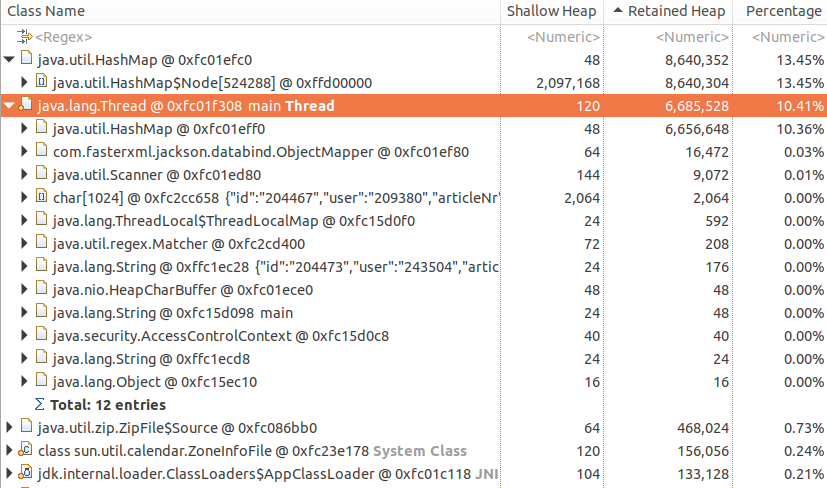
which is not immediately helpful - top dominators take 25% of memory, while we clearly filled whole heap. In cases like above, histograms are more useful, so lets create one and sort items by retained heap size:
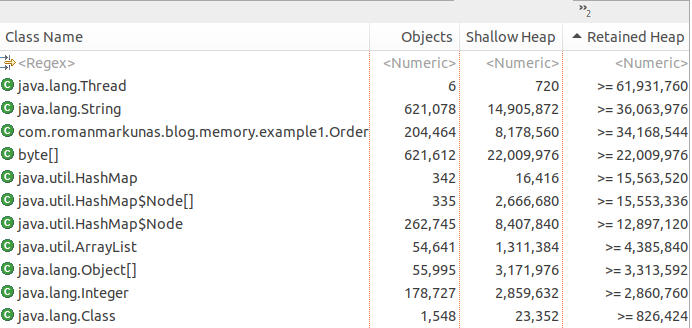
Here we can see a huge amount of Order objects and, assuming it is our normal production scenario, we have found our offender.
Histograms can be useful in finding memory/resource leaks in conjunction with other metric collection tools for your system. For example, if you publish count of current active TCP connections via metrics interface, but then you find out that number of
Socketobjects in heap is much bigger, it is an obvious resource leak.
For a typical heap it is very likely that top objects would be byte[], String, HashMap$Node, Object[] and ConcurrentHashMap$Segment. And in bigger application it’s typically not obvious what is holding all these objects. To find out right click on desired class object and select “Immediate dominators”. Our example for String would give:
which tells us, that most String instances are retained through Order objects or a GC root, which is main Thread. Also in histogram view: right-click on String -> “Merge shortest paths to GC roots”, would give:
which tell us that String objects are specifically retained as:
Orderobject fieldsuserandaddress, which in turn areHashMap$NodevaluesHashMap$Nodekeys
Again Order#id is not retaining strings, as collecting order would not result in collection on id String instance, because it is also retained as HashMap$Node key. Collecting the whole node, however would cause id to be collected, as both key and value would no longer be reachable.
To obtain heap dump of live process, the recommended tool since Java 9 release is jmap which is shipped together with JDK, for example jmap -dump:live,format=b,file=dump.hprof <java-process-pid>. Alternatively, if JVM is launched with PrintClassHistogram option kill -QUIT <java-process-pid> will also do it. However, the latter option overrides default behavior of printing thread dump on SIGQUIT).
Profiling - online profilers
Analyzing heap dump is great, but not always possible as it causes stop-the-world pause, therefore not applicable when monitoring production systems (heap dumps can induce very long pauses). To avoid this we can use online profilers, that collect sample data during runtime. Of course, we don’t get full picture using such method, but it still can give some clues on how application works and narrow the suspect circle.
Let’s take a look at JDK flight recorder, which is free feature of JDKs as of version 11. To get this right we will need to tweak quite a few configuration options to enable continuous recording so that we can periodically dump sample data (another option would be to start recording periodically using jcmd <PID> JFR.start <all the same otions> command):
-XX:+FlightRecorder- this enables JDK flight recorder-XX:FlightRecorderOptions:memorysize=5m,- be aware of additional buffer that is required to collect sampling data, with size set here. Enabling JFR would also somewhat expand metaspace and use some extra heap.stackdepth=32- maximum stack depth to walk. Tuning this can help limit sampling overhead, cause some part of the stack might not be interesting, e.g. framewrok/servlet container dispatching-XX:StartFlightRecording:- starts a recording as part of JVM launchname=SampleRecording,- assigning name can help to dump the correct recording usingjcmd <pid> JFR.dump name=SampleRecordingsettings=default,- path to setting file, which instructs JFR what kind of events we care about. We will have to make our own to profile memory, see below, howeverdefaultis very low overhead and can be safely run in production continuouslydisk=false- do not write recordings immediately to disk. This makes sense for continuous recording when we want to periodically dump ourselvesdumponexit=true,- dump sampling data if JVM crashes unexpectedlymaxage=1h- maximum length of sampling data to be kept in buffer-Xlog:jfr*- log out JFR events for the curious
2 settings files, that come by default with jdk do not collect memory data. Let’s tweak them using JDK Mission Control app, which we also will need to analyze recording data later. You may want to download build from OpenJDK, if you, like me have problems with Live Object histogram rendering. To do so, open Window -> Flight Recording Template Manager and duplicate <jdk directory>/lib/jfr/default.jfc. Then change “Memory Leak Detection” to “Object types + Allocation Stack Traces + Path to GC Root”. Export this file and specify its location using settings option above. Because we do not alter memory profiling options, the extra overhead should not be too big, however, be careful and measure if you plan to use this in production.
Once we have a profile ready (see example 5 for full option list) we can drag-and-drop it into JMC and inspect. We are interested primarily in “Live Objects” section (if you can’t see histogram with live objects on the top, try pulling top of table down):
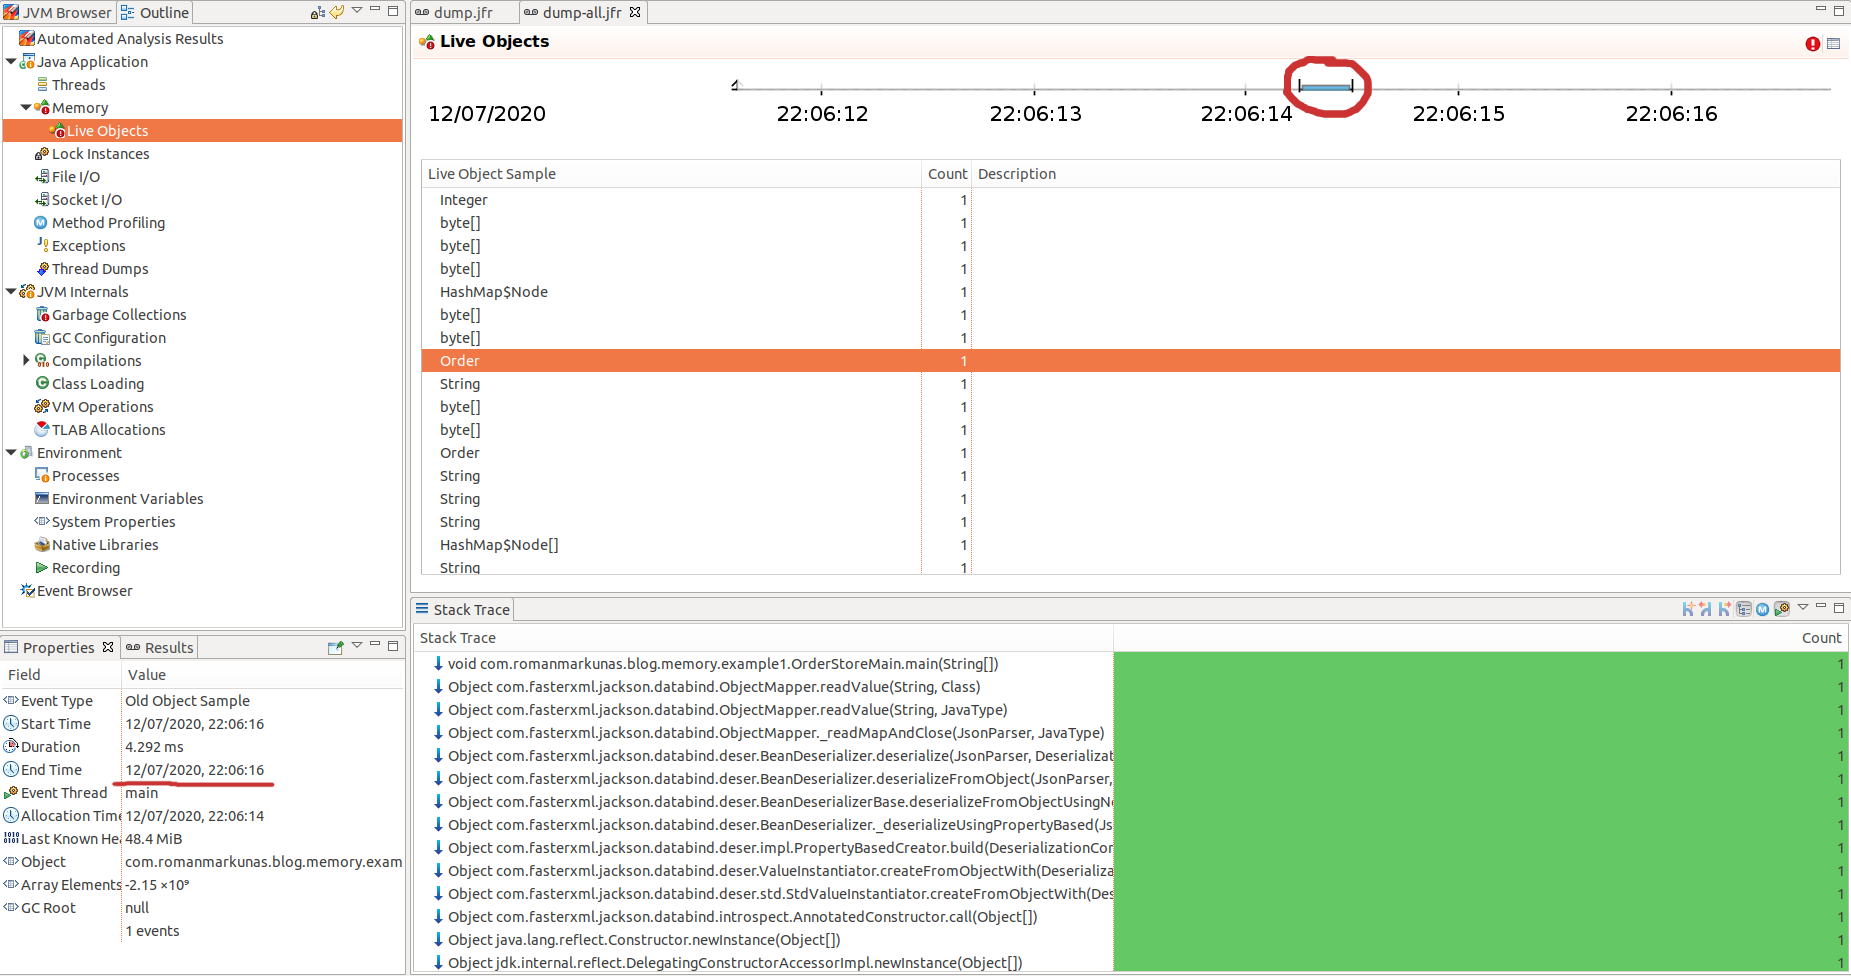
This is a list of sampled objects for a period of time encircled with red. The total count will be much less than actual allocation count, but statistically it would be a representative sample of objects allocated and still alive. The samples are taken from TLAB every time it is filled and JVM assigns another TLAB to a thread. The exact mechanism how samples are selected from TLAB is described here - for general sampling approach and here - for Old Object Sample event.
What we can tell from that list is that all these object were still alive at the point when record was taken (JVM crash in our case), therefore some of these objects are candidates for memory leak/memory optimisation. We can find out which part of the code retain them by tracing allocation StackTrace in the bottom section and looking through code where these new objects were stored afterwards. In our case we can see that lots of String and HashMap internal objects are allocated and retained by Order objects.
One can notice that overall number of samples is quite low. The reason is that samples are chosen once TLAB is full and in this case TLAB size is relatively big to overall heap size (64 megabytes), hence small amount of TLABs and samples. By forcing smaller TLAB we can get more samples (example 7).
Another useful section can be “TLAB Allocations”, especially if you think you allocate too many big objects, that do not fit TLAB. To have that section populated, we must change “Memory Profiling” configuration to “Object Allocation and Promotion”. Or just use memory-all.jfc provided with example code.
Overall we can reconstruct quite similar picture to what we had when looking at the heap dump. It is bit more involved as we deal with sampled data and need more manual tracing, however we do not pay penalty of increased latency.
Intermission
In this part we have covered a few ways to determine what data is taking heap space. We have not covered probing here, as probing gives diminishing returns when we talk about heap occupation. In the second part we will take a look at what can be done to reduce heap usage by our sample program.